Short on time? Listen to this article on-the-go.

You learn the most after a slight period of confusion.
As an ex-physics professor, I always start my talks with that sentence. Why? Because rocket science — with all its complex graphs and numbers — is a daunting subject. It’s crucial, however, to dive deep into data before “coming up for air” in the form of analysis and, eventually, insights.
The space industry is just starting to emerge from a period of confusion thanks to the growing amounts of data on objects, operational and non-operational, in low Earth orbit (LEO). This data is being fed into increasingly intelligent tools, like LeoLabs’ LeoRisk, that are helping us generate insights and drive operational decisions. These solutions ultimately enhance space safety in LEO.
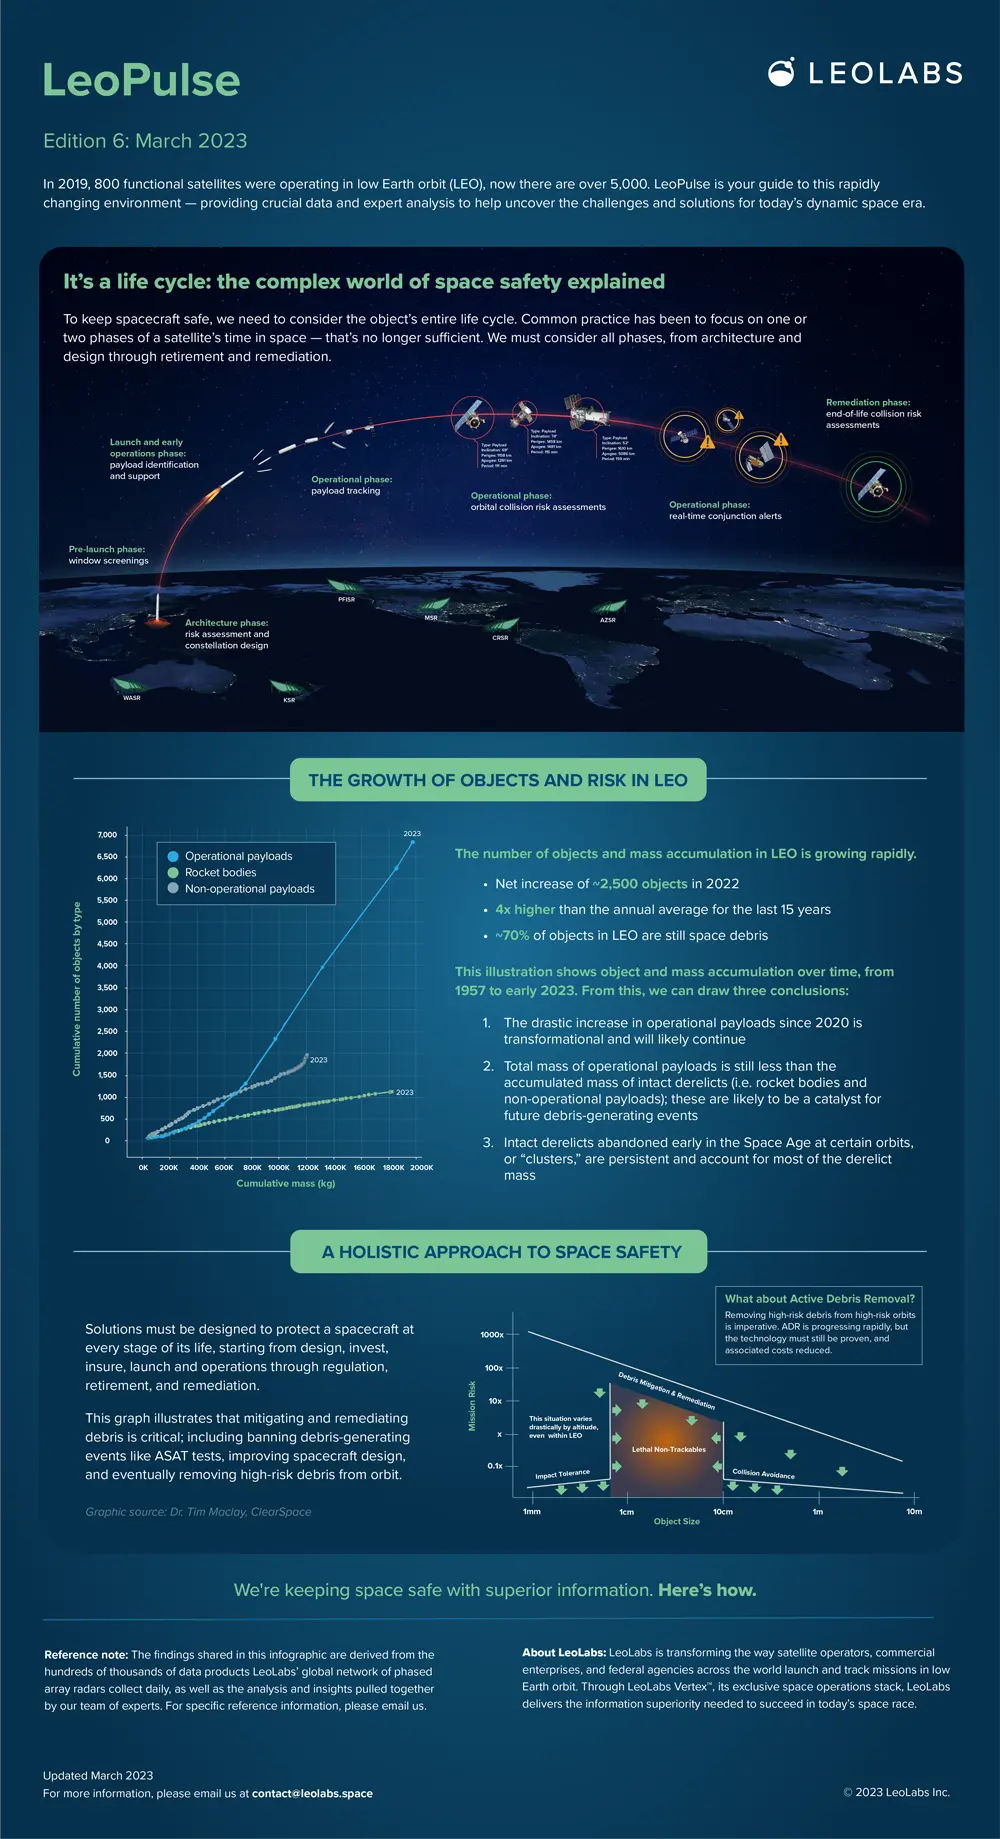
What I and many others have come to conclude seems rather obvious in hindsight: to keep spacecraft safe, we need to consider the object’s entire life cycle. Common practice for regulators and owner-operators has been to focus on one or two elements of a satellite’s time in space, with the primary focus being collision avoidance. Today’s space environment, however, is more complex and dynamic than ever before, which means we must think through the entire life cycle of a satellite. That starts from design and manufacturing through launch, deployment, orbital operations, and ultimately, retirement and removal.
“What I and many others have come to conclude seems rather obvious in hindsight: to keep spacecraft safe, we need to consider the object’s entire life cycle.”
Before talking about what the life cycle of space safety looks like, let’s walk through the growth of traffic in LEO and the subsequent risk.
Feeling crowded? A quick review of the growth in LEO
It’s become general knowledge that the number of objects in LEO is growing rapidly. As my team and I explained in our 2022 annual review, there was a net increase of ~2,500 objects in 2022 — that’s four times higher than the annual average we calculated over the last 15 years. While operational payloads accounted for most of this growth, ~70% of objects in LEO are still space debris. Alongside this growth is mass accumulation, which is an important component in assessing future debris-generating potential.
It’s one thing to talk about these rates of growth, it’s another thing to see it. The time-sequence video below starts from the beginning of the Space Age (i.e., 1957) and includes data from the first few months of 2023. The left panel depicts the number of intact objects (such as operational payloads, non-operational payloads, and rocket bodies) deposited at each altitude annually. The panel on the right depicts the accumulation of mass for each of these three object categories over time.
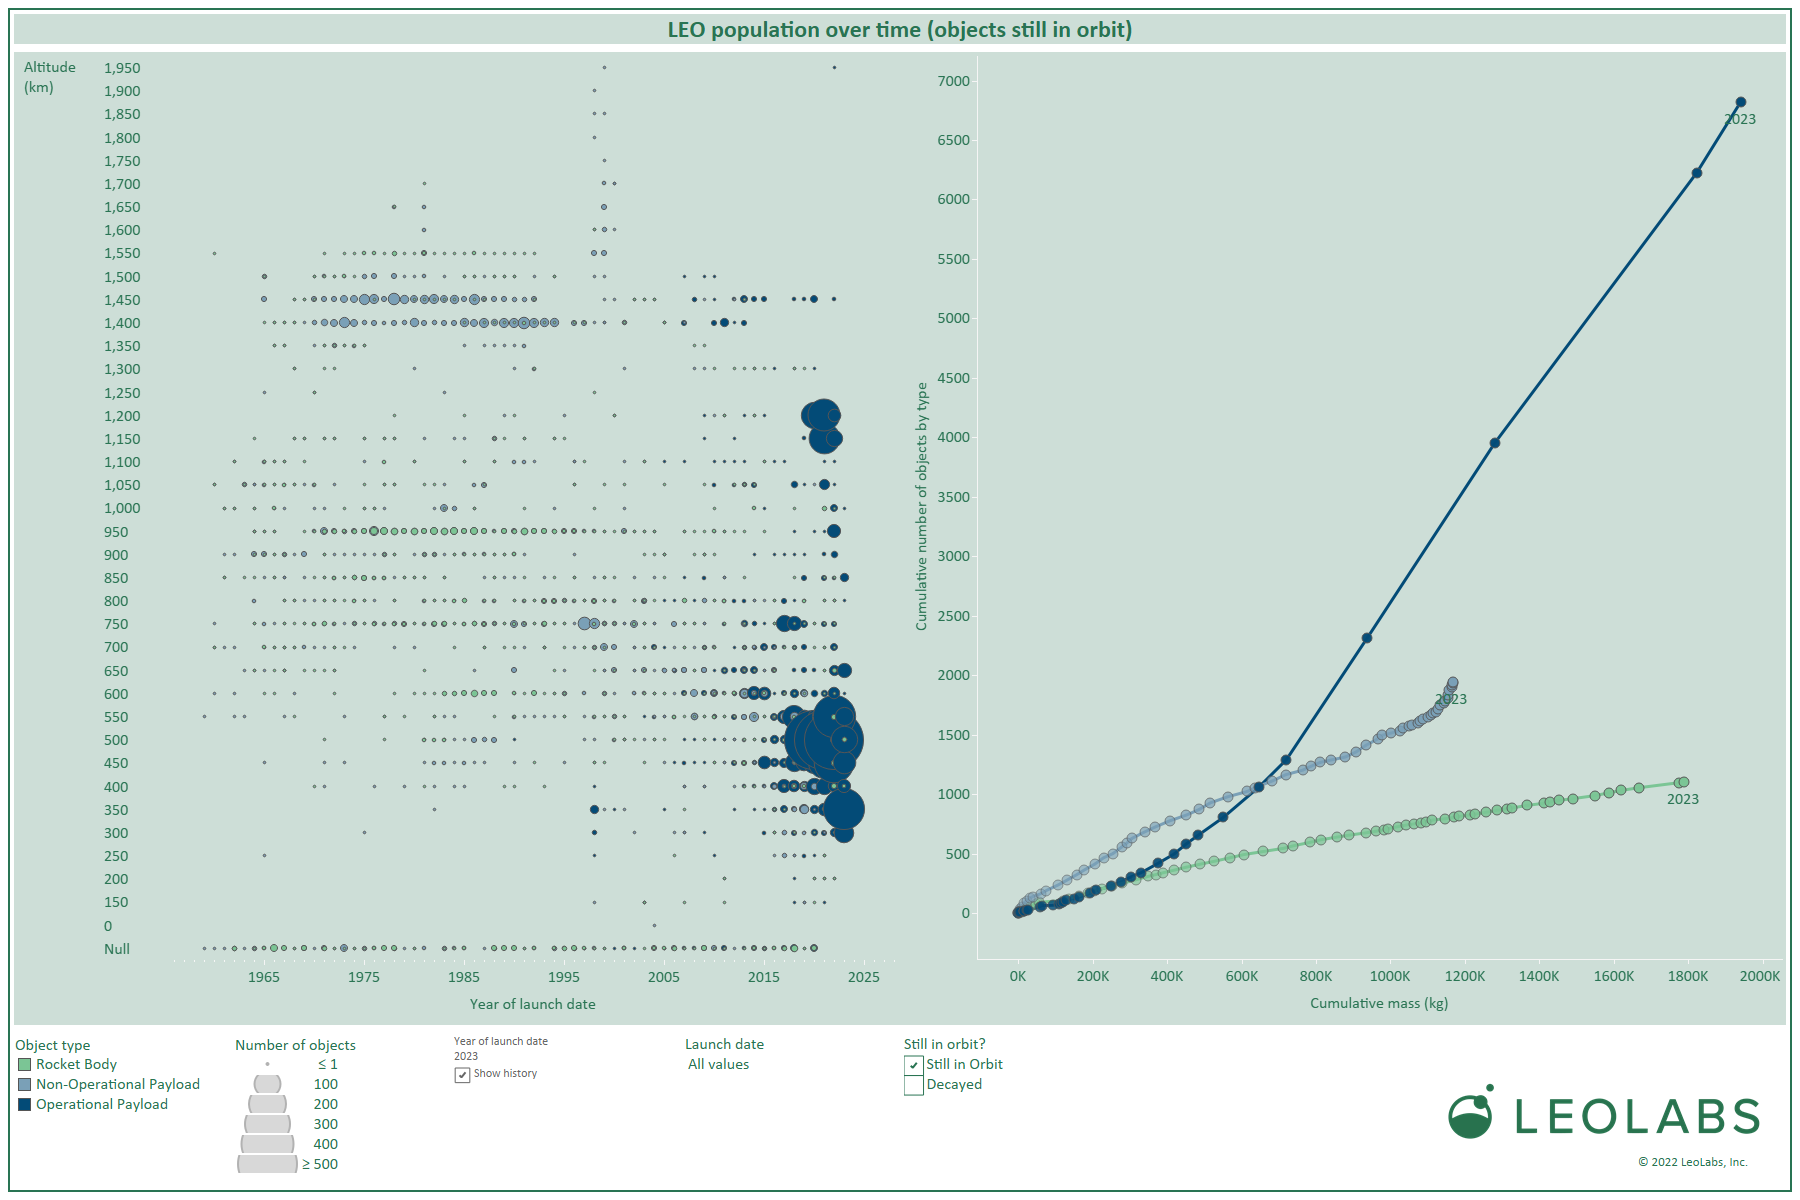
From this illustration, we can draw three important conclusions:
- The drastic increase in operational payloads since 2020 is transformational and will continue for the near future.
- Despite the exponential increase in the number of operational payloads, their total mass is still less than the accumulated mass of intact derelicts; these large derelicts are likely to be a catalyst for future debris-generating events.
- Rocket bodies and non-operational payloads abandoned early in the Space Age at certain orbits (now called “clusters”) are persistent and account for most of the derelict mass in LEO.

What’s risk got to do with it?
A lot.
Alongside the growth of traffic in LEO is collision risk, particularly in orbits where massive derelicts were historically abandoned. We refer to these as “bad neighborhoods.” To fully explain this risk, I’d need hundreds of pages, dozens of charts, and strong coffee, but I’ll try to break it down succinctly here.
First, to understand risk to objects in LEO we need to understand how we calculate the probability of collision, or Pc.
The statistical Pc of a single object over time considers characteristics and numbers of all the resident space objects that might cross the object’s altitude. It’s calculated by multiplying four terms together:
- Timeframe under consideration
- Collision cross-section (which accounts for the object’s size and the average size of the other objects with which it might collide)
- Spatial density of other objects in the same altitude region (i.e., number of objects per cubic kilometer)
- Average relative velocity between these objects (~12 km/s in LEO)
Note: For a more detailed explanation of calculating statistical collision risk, read our “collision risk story.”
To help us calculate Pc and understand risk in LEO, we’ve created a suite of analytic tools. The linchpin of these tools is our “calculator” for space safety: LeoRisk. This tool allows us to determine the statistical Pc levels from cataloged objects and lethal (currently) untracked debris (as modeled by the European Space Agency’s MASTER model). Other analytic tools that provide supporting insights to LeoRisk include characterizing dangerous objects/orbits and determining the cause of breakup events. Based on our data and analysis, we’ve identified four broad types of break-up events that occur in LEO:
- Low intensity explosion
- High intensity explosion
- Catastrophic hypervelocity collision
- Non-catastrophic, non-hypervelocity collision
In addition, there are many potentially mission-degrading collision events between operational payloads and debris too small to be tracked currently.
Why do these events matter?
Every time a collision or explosion occurs in LEO, especially at higher altitudes, the harmful results are additive because the debris created from the collision is not cleared from orbit for decades, even centuries. For example, in November 2022, a Chinese CZ-6A rocket body exploded in the “bad neighborhood” of 800 to 900 km. The resulting debris increased the overall number of debris fragments in LEO, which, in turn, increased the Pc at 830 km by 9%. Since the explosion, LeoLabs has observed conjunctions with resulting debris fragments as low as 400 km and as high as 1700 km.
“Every time a collision or explosion occurs in LEO, especially at higher altitudes, the harmful results are additive because the debris created from the collision is not cleared from orbit for decades, even centuries.”
It’s difficult to generalize what’s going on in LEO because the risk environment differs depending on several factors, including spatial density, object mass, type of object (e.g., small fragments, derelict rocket bodies, operational payloads, etc.), altitude, and more. For example, only 25% of the debris fragments from the Russian ASAT test in November 2021 are still in orbit. However, 80% of the debris fragments resulting from the 2007 Chinese ASAT test are still in orbit. This is primarily because of the influence of atmospheric drag at the location of the event: the Russian test occurred at 500 km while the Chinese test occurred at 865 km.
Finally, we’ve observed an increase in Space Traffic Management (STM) conjunctions relative to Space Debris Management (SDM) conjunctions. A STM conjunction is any close approach involving at least one operational payload, while a SDM conjunction is between two dead objects. On average in 2022, there were twice as many STM events as SDM events, but once you look closer it gets a little confusing. (And that’s okay!) In early 2022, we observed that the proportion of events was 40% SDA and 60% STM. By the end of the year, however, this proportion grew to 80% STM and 20% SDM. This indicates an increase in high-Pc events involving satellite operators, which means it’s becoming more critical for them to procure advanced collision avoidance services and share data related to their satellites’ position in space.
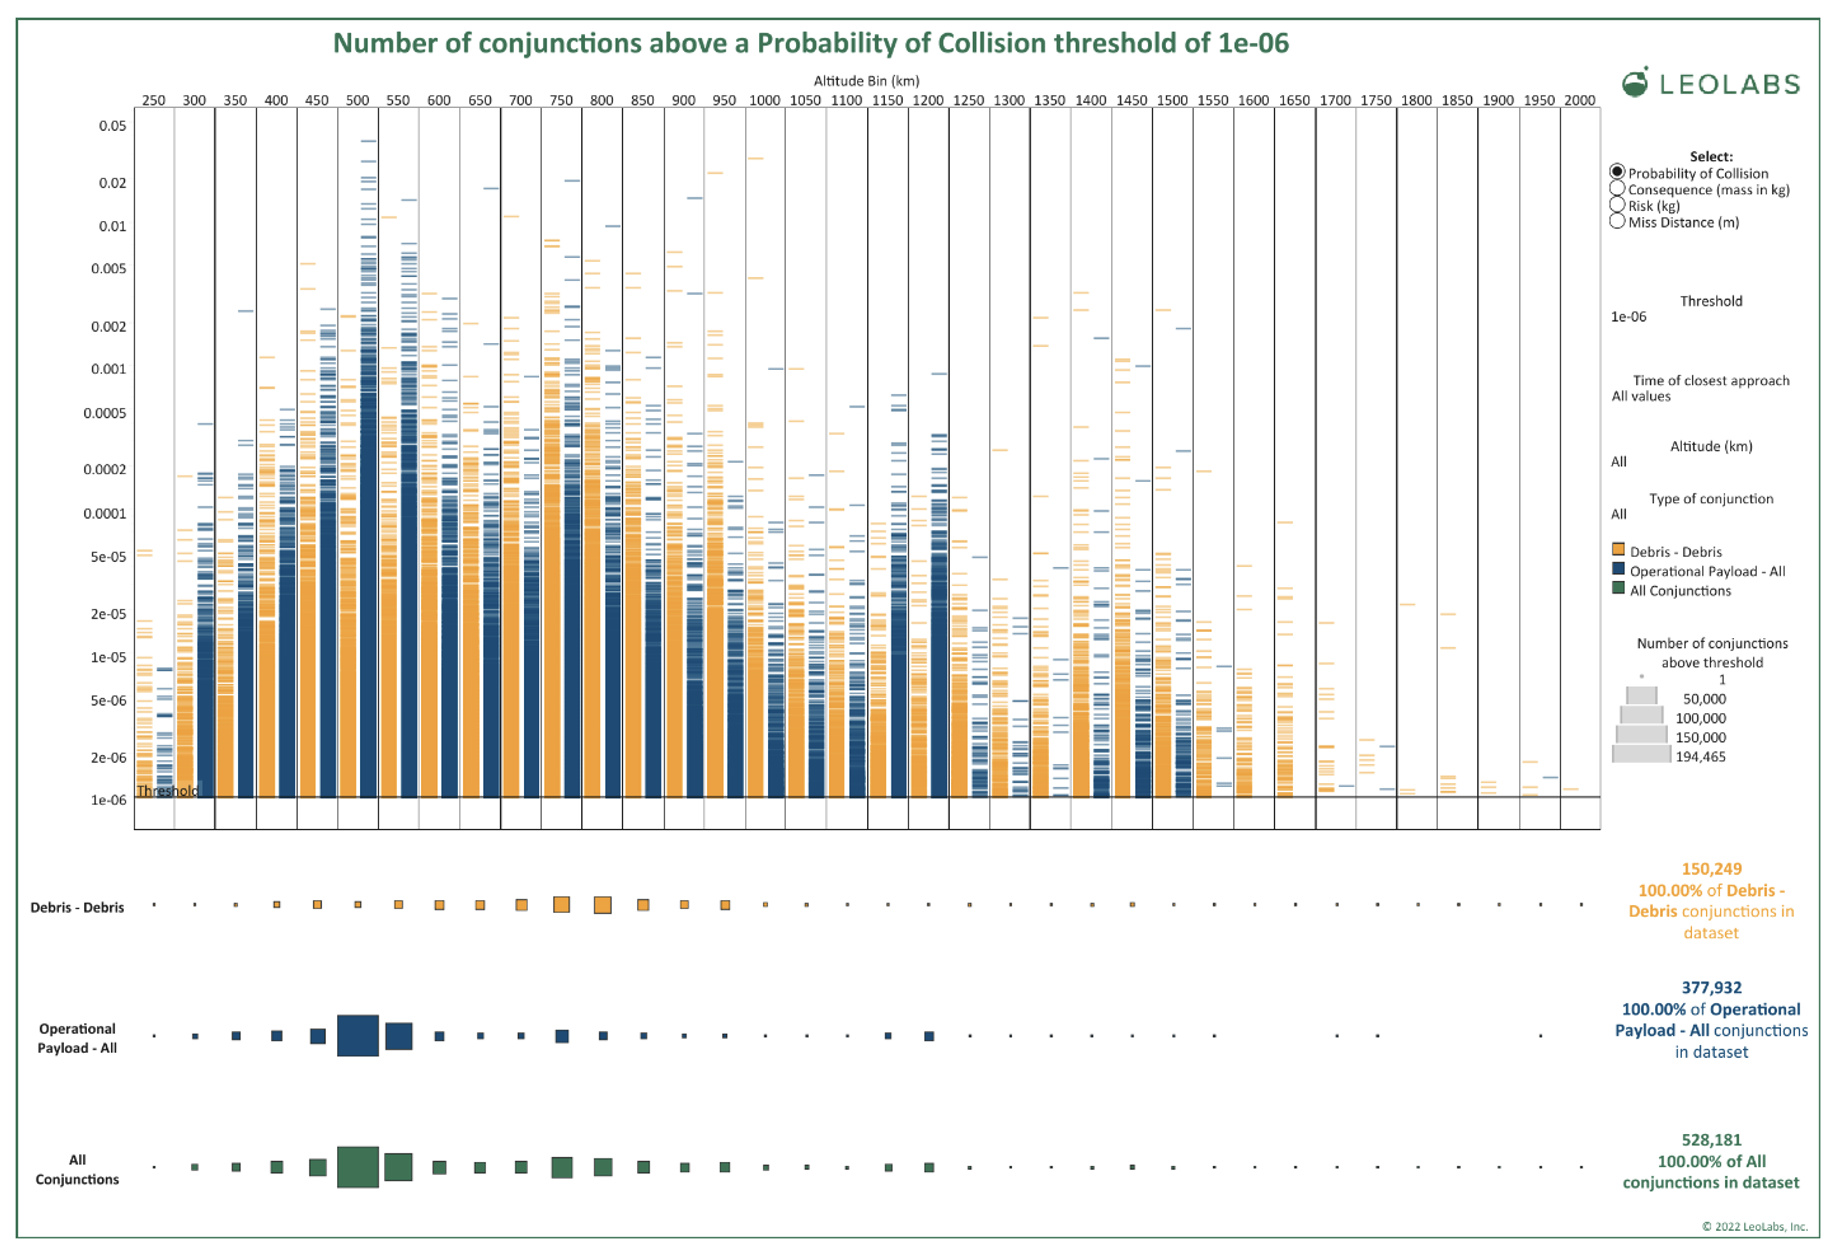
In the graph above, the orange plotting characters depict SDM events, and the blue represents STM events observed between 1 January 2022 and 15 March 2023. From this illustration we can conclude that there have been over half of a million high-PC conjunctions in LEO during this period. In addition, we can observe that STM and SDM conjunctions peak at different altitudes, with SpaceX, Iridium, and OneWeb constellations clearly standing out.
This data illustrates the simple fact that analyzing collision risk is complicated — and as I like to say, the only generalization that is true is that no generalization is true.

How to mitigate risk and protect a satellite throughout its life cycle
Now that we broadly understand the risk in LEO, let’s discuss how we mitigate that risk and protect operational objects.
For much of the Space Age, hope was our best option. I don’t need to tell you that hope doesn’t get you very far in an increasingly risky situation. Luckily, many satellite owner-operators recognize this and have begun to ensure their spacecraft have a certain level of impact and fault tolerance in the form of on-orbit services, “shelter in place” protocols, or hardware changes. However, more needs to be done to mitigate the collision risk in LEO.
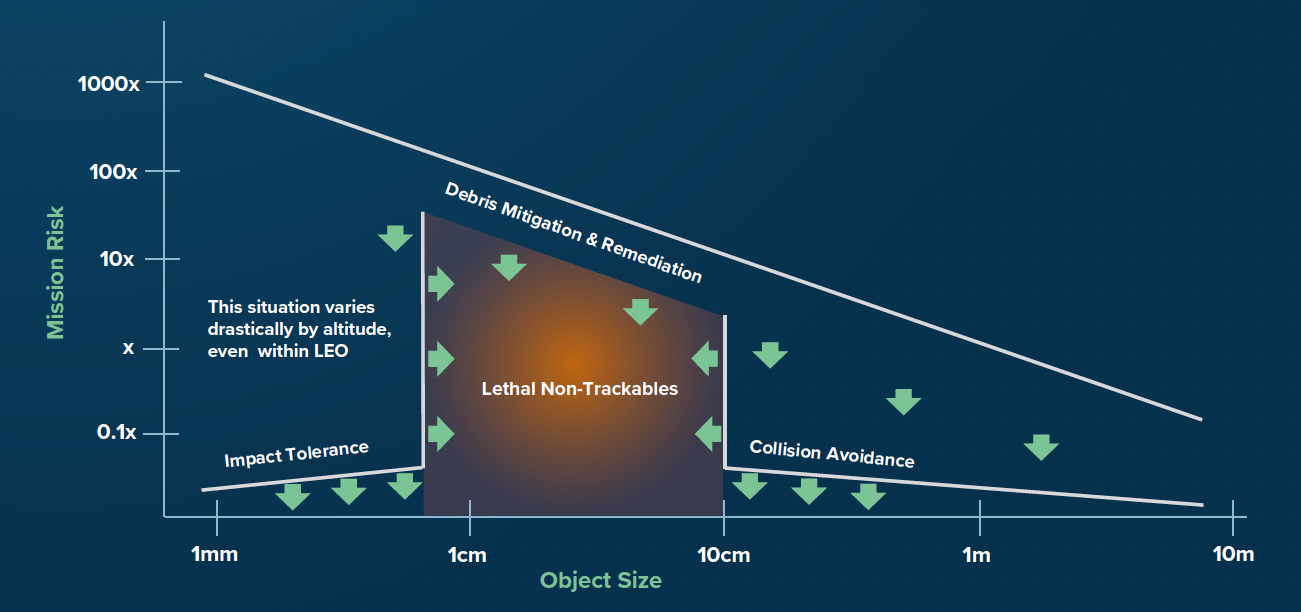
As illustrated in the image below, developed by Dr. Tim Maclay at ClearSpace, not only do we need to improve impact tolerance, but we also need to mitigate and remediate debris, and support collision avoidance.
Collision Avoidance
Let’s look first at collision avoidance (CA). Globally, there has been an increase in efforts to build Space Situational Awareness (SSA) networks and Space Traffic Management (STM) systems necessary to do this more effectively. Situated within these systems, we’ve built a suite of services and products to help protect a spacecraft at every stage of its life; starting from design, invest, insure, launch and operations through regulation, retirement, and remediation. This product suite is powered by our growing phased-array radar network dispersed across the globe consisting of 10 radars across six sites. (Soon to be seven!) These radars collect thousands of data points daily on over 20,000 objects in LEO.
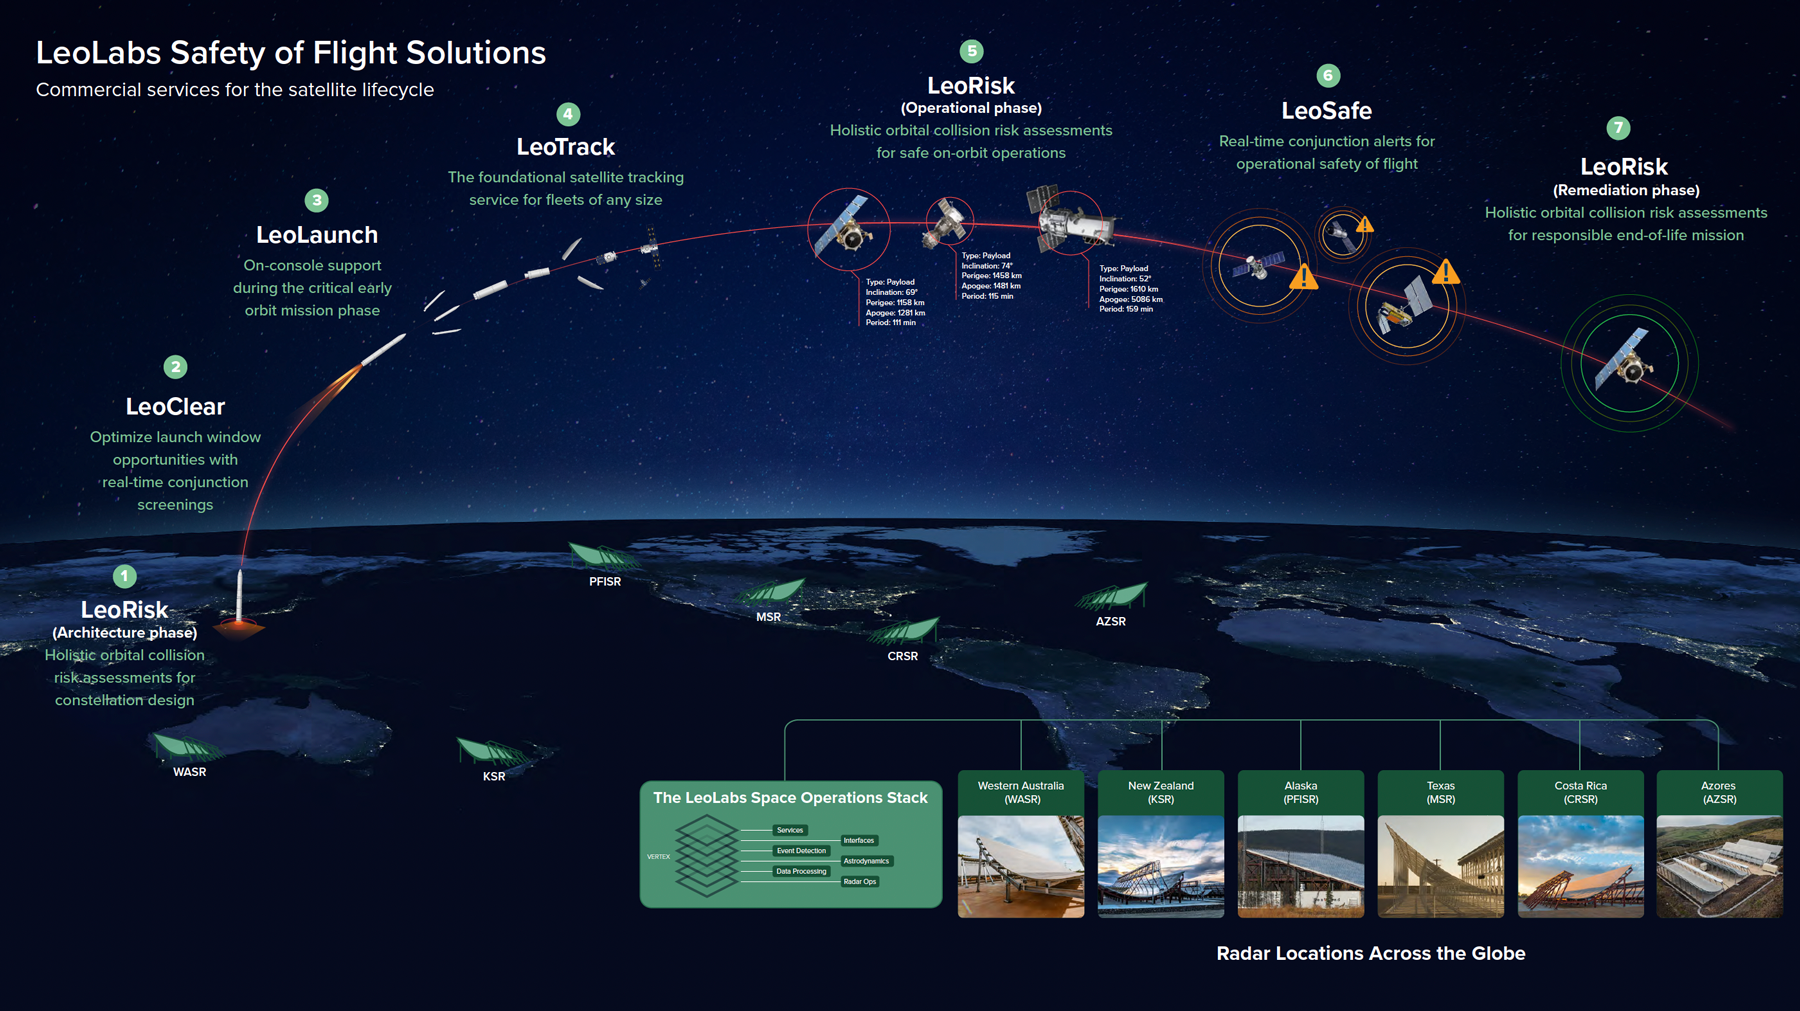
These tools and services assist largely with CA. In particular, they help us understand where constellations overlap, share ephemeris and covariance realism, as well as develop a global set of standards and best practices that are key to ensuring satellites don’t collide with other objects. But collision avoidance can only take us so far. What about space debris or non-maneuverable operational satellites? Here is where debris remediation and prevention come in. To reduce the collision avoidance burden, we must not only reduce existing debris but prevent the addition of new debris.
Debris mitigation
There are several ways to prevent more debris. While increasing impact and fault tolerance on spacecraft and developing better collision avoidance is important, we also need to ban debris-generating events, like ASAT testing. In addition, we need to ensure satellite owner-operators de-orbit their satellites once their missions have ended. Thanks to the US Federal Communication Commission’s (FCC) new 5-year-rule and a global moratorium on destructive, on-orbit ASAT testing, we’re on the right path regarding both issues.
Debris remediation
Remediating debris is more complicated. This requires actively removing debris from orbit, especially objects in high-risk orbits (i.e., “bad neighborhoods”). While there are promising Active Debris Removal (ADR) technologies in development, it’s still an expensive endeavor. (Although, I’d argue it’s more expensive to the industry not to remove debris!) Due to the expense and required effort, prioritizing the most dangerous objects in the most dangerous orbits is critical for ADR investment and planning.
“Due to the expense and required effort, prioritizing the most dangerous objects in the most dangerous orbits is critical for ADR investment and planning.”
In 2019, a team of researchers and I identified the top 50 statistically-most-concerning objects in LEO. In 2022, I updated this process using LeoLabs’ suite of analytic tools, which enabled me to leverage a half million high-accuracy depictions of close encounters in LEO. (This data wasn’t available before!) Echoing findings in the original paper, this new analysis confirmed that the 18 SL-16 rocket bodies clustered between 815 to 865 km remain the largest contributors to future debris-generating potential in LEO. While several other abandoned rocket bodies and non-operational payloads were identified as worrisome, this review reinforced the idea that the “bad neighborhoods” centered around ~840 km and ~975 km must be remediated first to reduce the chances of large collision events.
Let’s dig a bit deeper into one example.
Earlier this year, one of the SL-8 rocket bodies identified in the top 50 analysis was involved in a near miss of 6 m with a Cold War-era dead Soviet payload. The Pc for this event was ~10% — that’s extremely high. An operator often considers a collision avoidance maneuver at .001%; events which are 10,000 times less likely than this near miss! As we said at the time, it was too close for comfort.
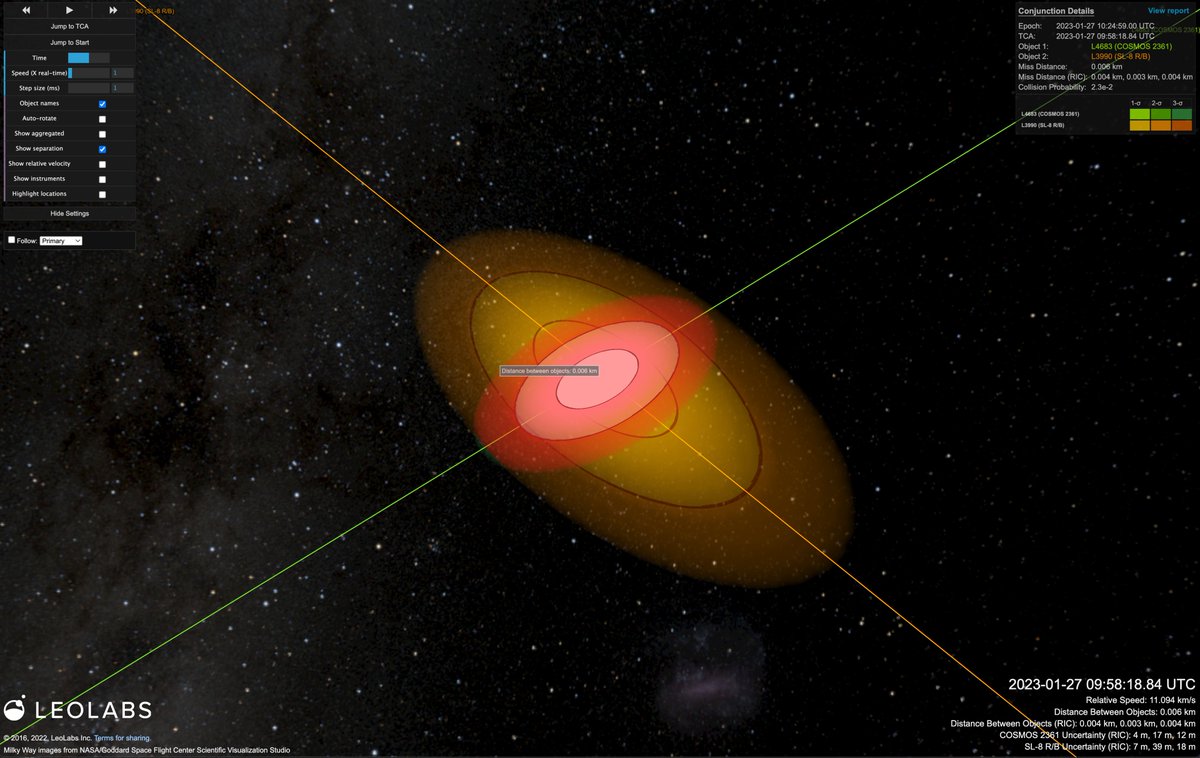
Unfortunately, these massive derelicts do not have the capability to avoid collisions. There’s nothing we can do, currently, to avoid this kind of dead-on-dead collision. However, this is exactly the type of event that developers of ADR aim to address.
While we know what we want to remove, it’s not that simple. In addition to the price tag, the technology must be proven, and difficult issues examined. How do we safely “remove” a large piece of debris from orbit without harming people or the environment here on Earth? In this case, we’re not eliminating risk; we’re displacing it. What’s more efficient and safer? Nudging debris into another orbit? Tugging it? Grappling it? It’s unclear. Luckily, there are several countries and customers blazing the trail in this area to provide solutions soon.

Out of confusion comes clarity
At this point, you may still be a little confused, but the situation should be getting clearer: we need to monitor and characterize the collision risks in LEO to catalyze and enable responsible action. This is not only for collision avoidance services but also for remediation operations on the horizon. Our analytic tool suite, with LeoRisk as the headliner, is supporting analysis to enhance these activities that span the life cycle of a satellite.
“We need to monitor and characterize the collision risks in LEO to catalyze and enable responsible action.”
As I said in my introduction, we’re just starting to emerge from a period of confusion in the space industry. By examining LEO as the interaction between constellations of operational payloads, clusters of massive derelicts, and clouds of fragments, we’re starting to demystify the swirl of objects and ideas related to space safety. Do we fully understand the risks in LEO? No, but we have a better picture today than we did yesterday and we’ll have a better picture tomorrow than we do today. Do we have all the technologies we need to keep space safe? Not yet, but they’re on the way. What is clear is we need to think about space safety holistically, starting from before a satellite is launched into orbit and ending once that same satellite has de-orbited.
It’s critical that we as a community come to the same conclusion: space safety is no longer a nice-to-have but an absolute necessity. From there we can continue to build the solutions necessary to keep space safe and sustainable.
More of a visual learner? We’ve got you covered. Download this infographic.
And that’s all for now folks!
Stay tuned for the special Quarterly Review edition of LeoPulse coming out in mid-April, which will focus on clouds of debris in LEO. If you haven’t signed up for our newsletter yet, please do so you don’t miss the next edition. Want more content like this right now? Check out the previous editions of LeoPulse.
Ad astra!
Note: The findings shared in this report and infographic are derived from the hundreds of thousands of data products LeoLabs’ global network of phased array radars collects daily.
